IoT Surveillance CCTV Camera using ESP32 CAM & Blynk
Surveillance CCTV Camera using ESP32 CAM & Blynk IoT
- Overview: ESP32 CAM Video Streaming Over Internet
- Components Required
- ESP32 CAM & FTDI Connection
- Source Code: IoT Based Surveillance CCTV Camera using ESP32 CAM
- Setting up Ngrok for ESP32 Camera
- ESP32 CAM Video Streaming Over Internet
- Blynk App setup for video streaming over Internet
- Printed 3D Enclosure for ESP32 CAM
- Video Tutorial & Guide
Overview: ESP32 CAM Video Streaming Over Internet
In this tutorial, I will let you know how to make your own wireless video streaming device in which you can stream that live video on the internet from anywhere in this world using the ESP32 CAM board and blink IoT platform. Hence, today’s topic is all about making IoT based Surveillance CCTV Camera using ESP32 CAM & Blynk cloud.
Components Required
Following is the list of the components for making an IoT based Surveillance CCTV Camera using ESP32 CAM. You can purchase all the components online from Amazon.
| S.N | Components Name | Quantity | |
|---|---|---|---|
| 1 | ESP32 CAM Board | 1 | https://amzn.to/2V5rHxD |
| 2 | FTDI Module | 1 | https://amzn.to/3zzU06q |
| 3 | Female - Female Jumper Wires | 5 | https://amzn.to/3kVFP7q |
| 4 | USB Cable | 1 | https://amzn.to/3eY5jx8 |
ESP32 CAM & FTDI Connection
For programming the ESP32 CAM board, you need USB-to-TTL Converter Module or an FTDI Module. So, Connect the FTDI Module with ESP32 CAM using the circuit diagram provided below.
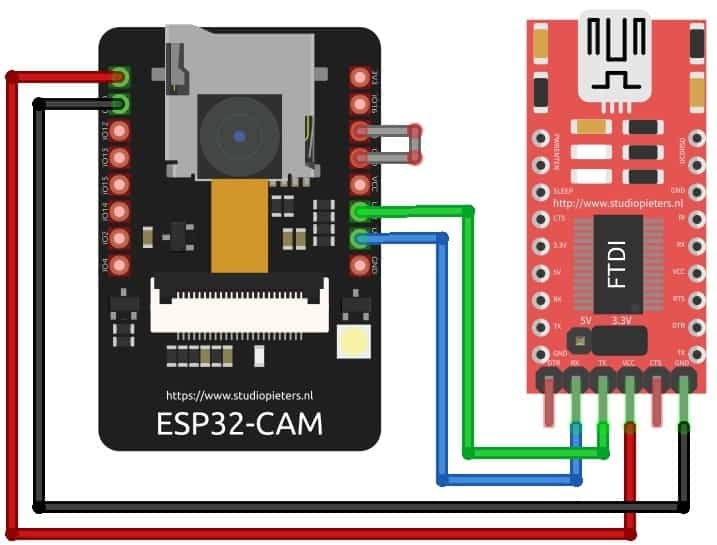
| ESP32-CAM | FTDI PROGRAMMER |
| GND | GND |
| 5V | VCC (5V) |
| U0R | TX |
| U0T | RX |
| GPIO 0 | GND |
Connect the 5V & GND Pin of FTDI module to 5V & GND of ESP32 CAM. Similarly, connect the Rx to UOT and Tx to UOR Pin. And the most important thing, you need to short the IO0 and GND Pin together. This put your ESP32 CAM Module into Download Mode. Once programming is done, you can remove it.
Note: So this is conversion of my previous project in which I could stream the live video within the local area network. So today I am trying to make this accessible over the Internet so that I can stream that live video from anywhere in this world. In case, if you haven’t read that previous post, I will suggest you read out that tutorial so that you can easily setup Arduino IDE for ESP32 CAM board.
Source Code: IoT Based Surveillance CCTV Camera using ESP32 CAM
I am going to use this code written by techiesms. Just download this code from the GitHub repository. Extract the file and open the .ino file on Arduino IDE. Now inside the code, you just need to enter your Wi-Fi Credentials Like SSID and the Password of your router in the “home_wifi_multi.h” file.
#define SSID1 "xxxxxx"
#define PWD1 "xxxxxx"
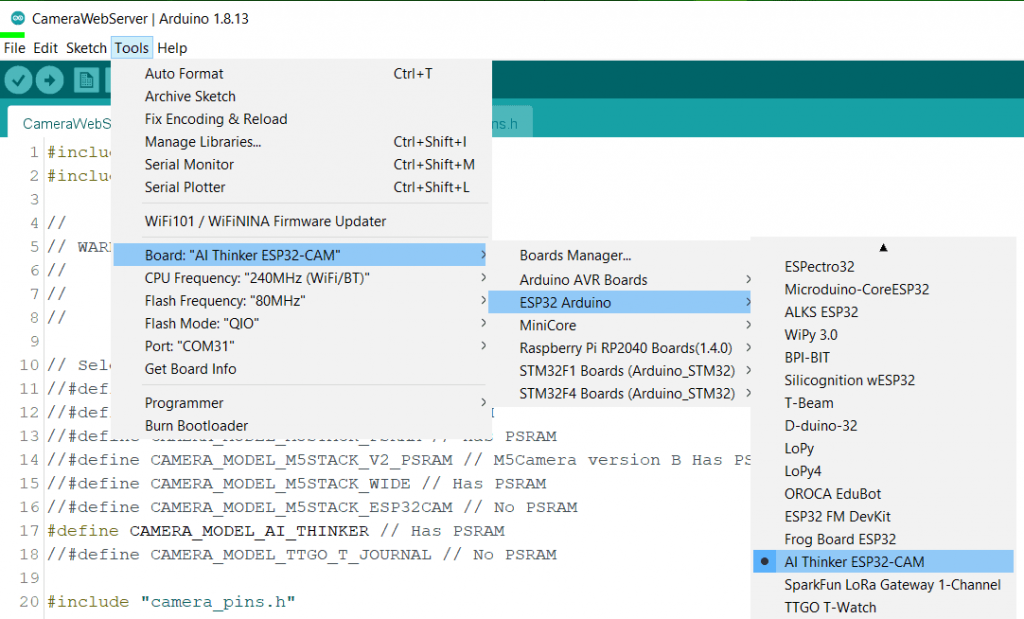
After that, you have to uncomment your camera model. In this example, I am using ESP32 CAM from Ai thinker. So I will uncomment this “define CAMERA_MODEL_AI_THINKER” line in the code.
// Select camera model
//#define CAMERA_MODEL_WROVER_KIT
//#define CAMERA_MODEL_ESP_EYE
//#define CAMERA_MODEL_M5STACK_PSRAM
//#define CAMERA_MODEL_M5STACK_WIDE
#define CAMERA_MODEL_AI_THINKER
Now the uploading process of code is simple. You need to connect all the components as shown in the circuit diagram. Then connect the USB cable to the PC and Hit that upload button by selecting AI Thinker ESP32 CAM Board from the board manager. And its COM Port in the Tools Menu. While compilation is completed and the dotted line appears, just press the reset button on the ESP32 CAM board.
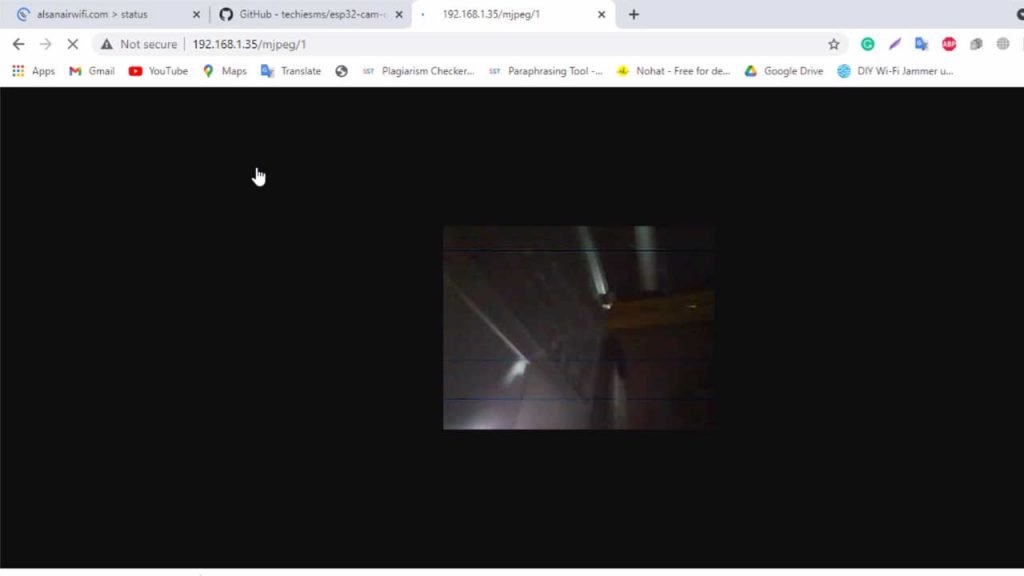
Okay, so I uploaded the code. Let us open the serial monitor. Here, as you can see, the board got connected to the Wi-Fi router, and it even got its local IP address.
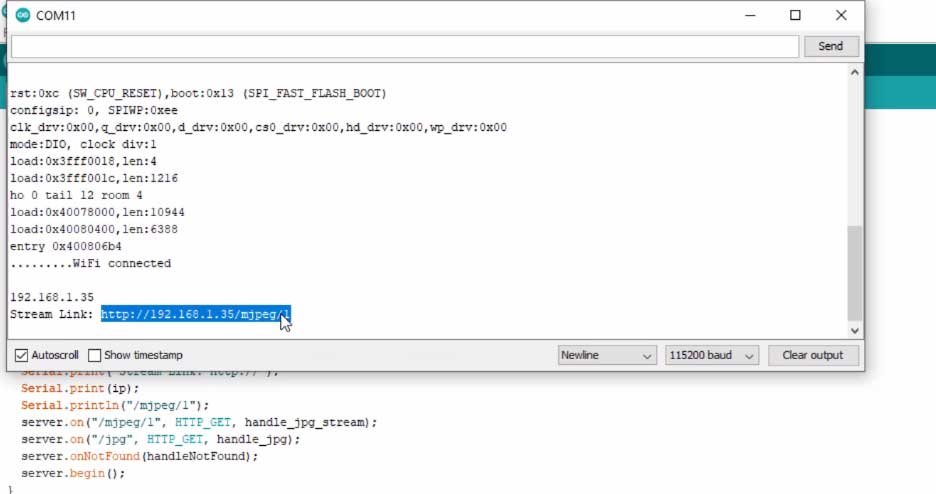
So here if I go to this local IP address /MJPEG/1 as you can see I can stream the live video here. But this will only work when my ESP32 camera and the laptop are connected with the same Wi-Fi router.
Also Read:
- ESP32 based Patient Health Monitoring System
- BME680 Indoor Air Quality Monitoring with ESP32
- ESP32 based MAX30100 Pulse Oximeter Webserver
Setting up Ngrok for ESP32 Camera
Now let’s just try to make this project work over the Internet for that you to perform a couple of steps on your Windows or Mac or Linux-based computer. Currently, I’m using my Windows PC. So let’s have a look over the steps to be performed. First, you need to go to a website called ngrok.com. Here you need to make an account and after that log into that account, after you log into your account, you need to download a file according to your system.
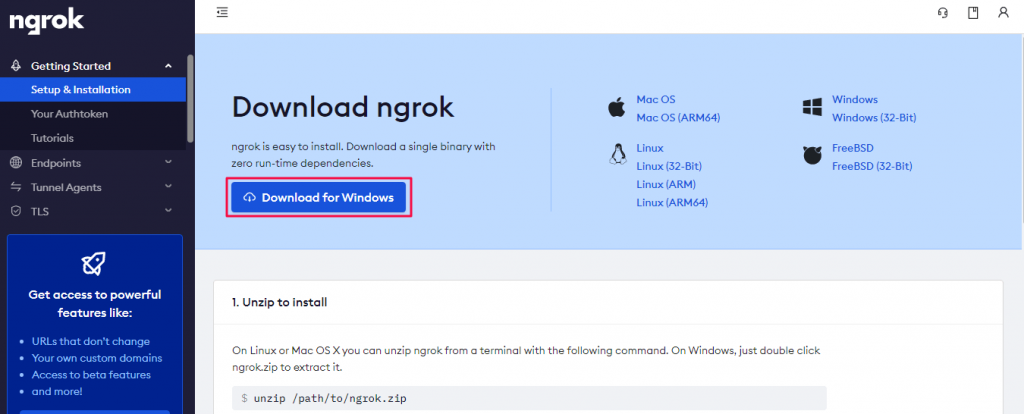
In my case, as I am using the Windows PC. I will download this Windows version. After that simply extract the zip file. Now open up the extracted folder and RUN this ngrok.exe file.
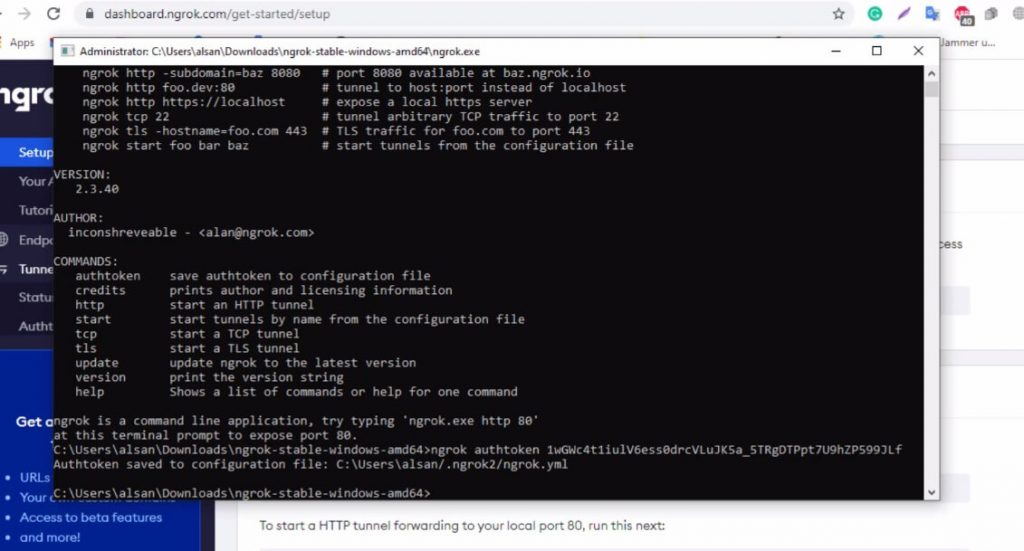
After that, enter this command which will store your unique API key into your system.
ngrok authtoken 1wGWc4t1iulV6ess0drcVLuJK5a_5TRgDTPpt7U9hZPxyz
So, that’s all about the configuration parts, which you can configure within two minutes. So now we are just one command away from making this project work over the Internet.
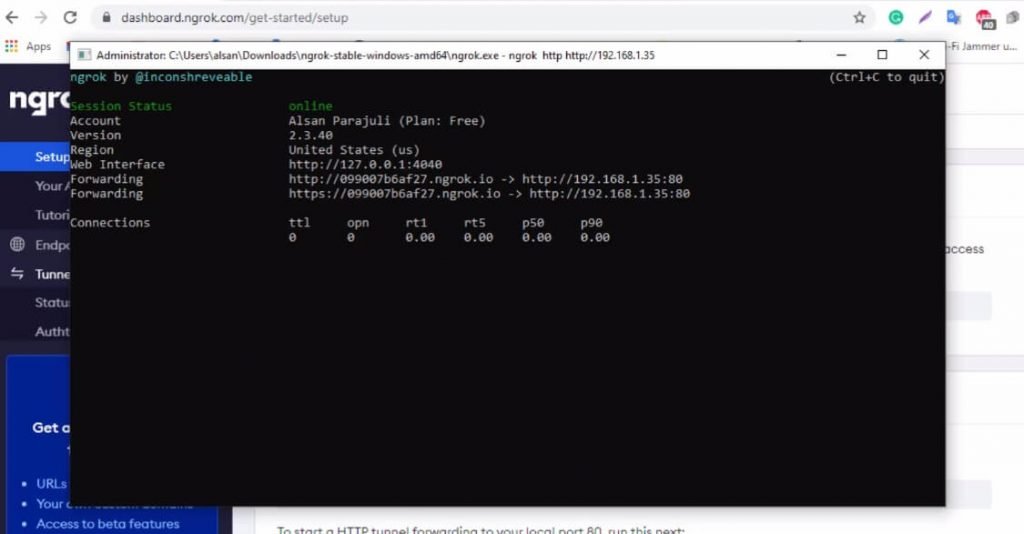
So let’s see what that command is, for that first you need to copy the local IP address assigned to your ESP32 CAM board. After that go back to the ngrok system and just type this command and paste this local IP address.
ngrok http http://192.168.1.35 Note: 192.168.1.35 is my local ip. Your will be different.
Now press Enter and you are done. Now we can live stream the video using this link.
ESP32 CAM Video Streaming Over Internet
Let me just copy it. I will go back to My Mobile Phone, first, I will disconnect my phone from the Wi-Fi and connect it to mobile data. Now, I will enter the link/mjpg/1
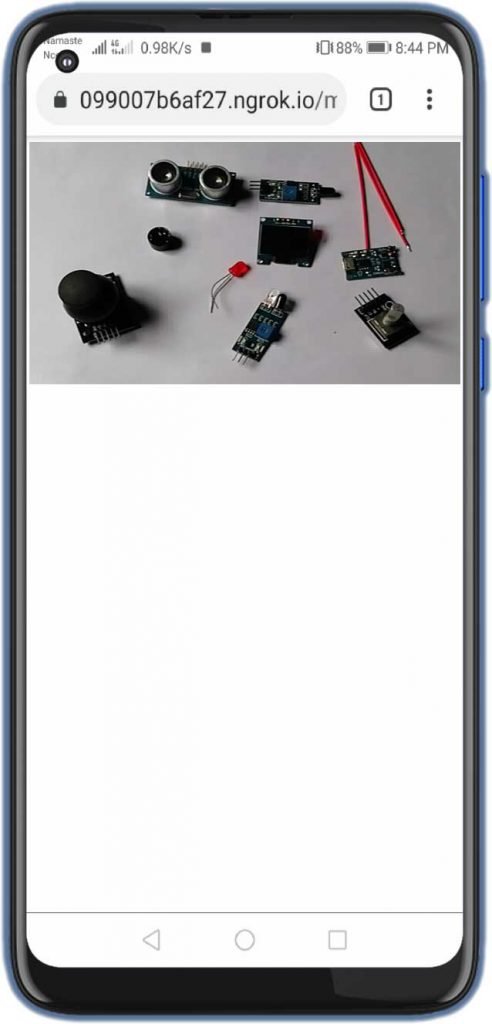
As you can see I can stream live video from my ESP32 CAM Board. But, this time it’s over the Internet. Isn’t it that simple? but a super project to make?
Blynk App setup for video streaming over Internet
Now you can make the same project using a blink IoT platform as well. So open up the blink app and create a new project. After that just tap on the screen and add this video stream widget.
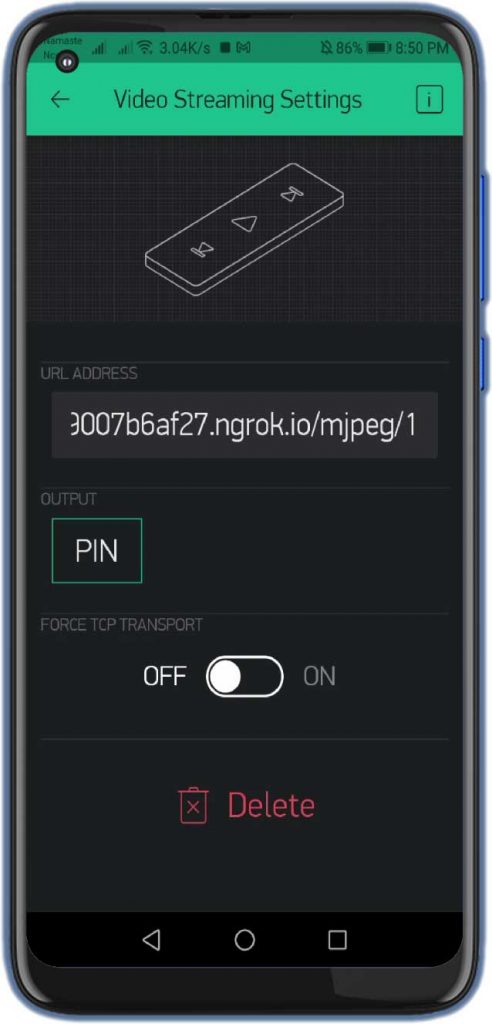
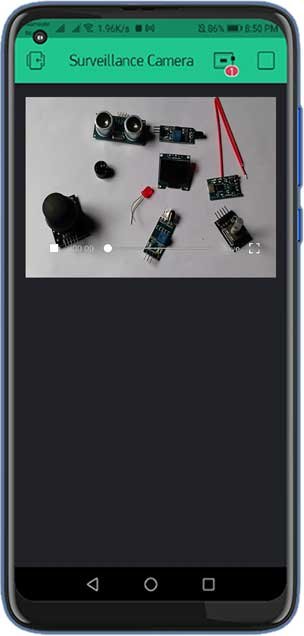
Now tap on the widget and paste that same link here. That’s it now, just click on the play button. Here, as you can see, I can stream the live video from the ESP32 CAM board onto my blink IoT platform over the Internet.
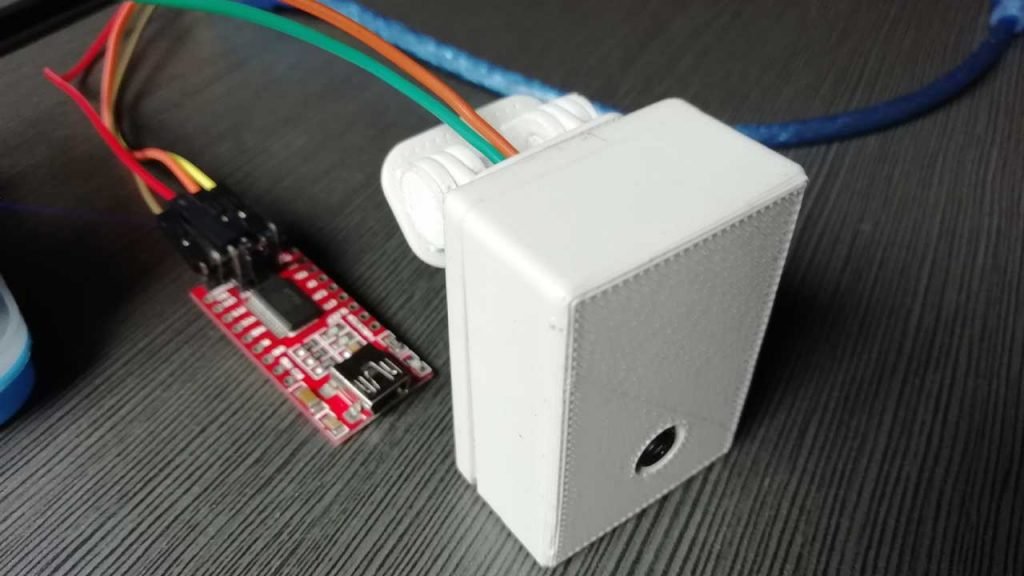
Printed 3D Enclosure for ESP32 CAM
Here, I have designed an ESP32 CAM enclosure and holder so that we can place it anywhere and use it as a surveillance camera.
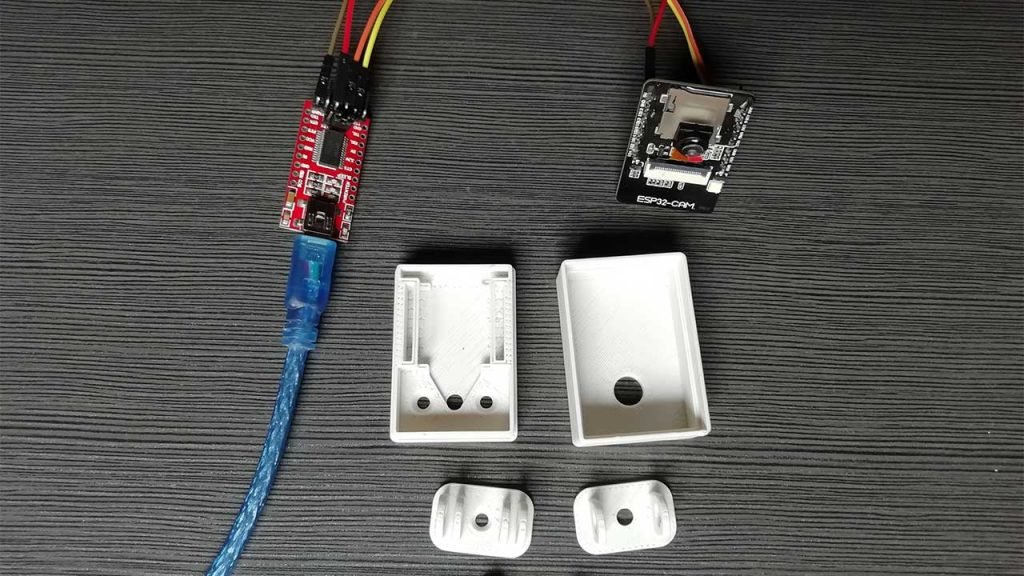
The 3D files are provided below simply download them. If you don’t have a 3D printer then PCBWay will help you. Recently PCBWay started CNC 3D Printing services. So, there is a $25 SALE on custom metal & plastic parts. Grab this Custom Prototype Manufacturing Service now.
Simply download the 3D Printing Model Files from above. Go to this link: https://www.pcbway.com/rapid-prototyping and then upload your zip file. Choose your preferences and place the order.
After assembling all the parts our ESP32 CAM is ready for video streaming over the Internet.
Video Tutorial & Guide
So, this is how we made our own IoT Surveillance CCTV Camera using ESP32 CAM & Blynk. Now you can place this CAM module inside this case. You can now use this device as a Surveillance CCTV camera. Now, you can make it by yourself. I hope this tutorial was helpful for you. If it was helpful, share this article with your friends.

How I can see camera with panel control (button control servo) in ngrok.i do that project with panel cont but ngrok I have just panel control with not camera please help if you have idea