IoT based Decibel Meter with ESP8266 & Sound Sensor
DIY IoT Decibel Meter with ESP8266
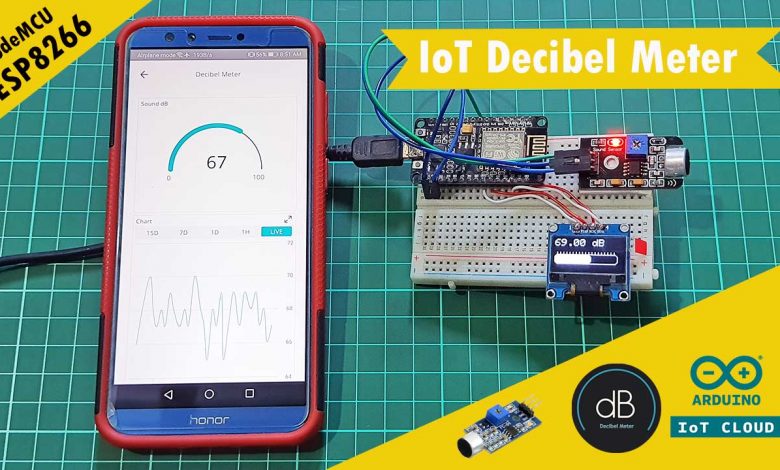
In this project, we will make an IoT based Decibel meter with NodeMCU ESP8266 & Sound Sensor then monitor the sound level intensity on the Arduino IoT cloud.
Overview
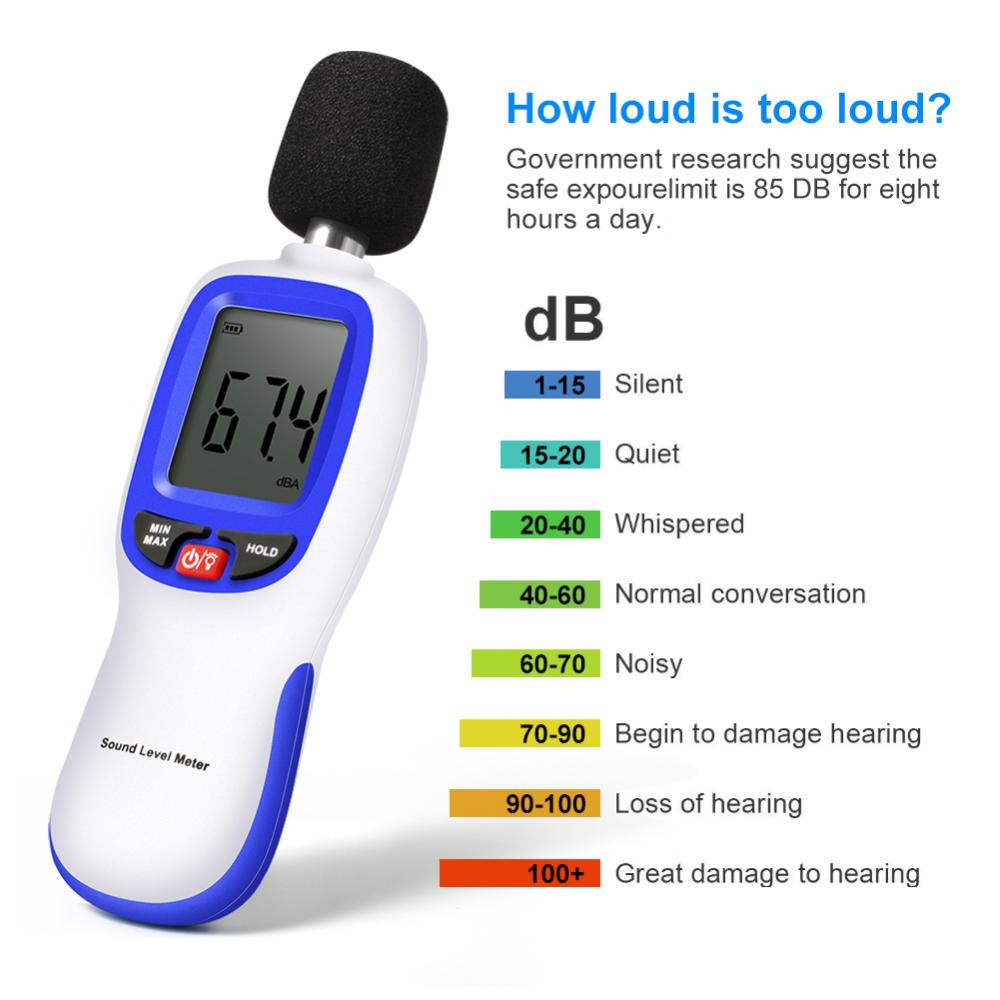
Generally, the sound level meter is used to measure the sound intensity of the surroundings. Condenser microphone combines precision with stability and reliability, hence it is best for the decibel meter. This device is sometimes called SPL (Sound Pressure Level) Meter because the diaphragm of the microphone responds to changes in air pressure caused by sound waves.
Decibel meters are commonly used in studies for the identification of different kinds of noise pollution, especially for industrial, environmental, mining, and aircraft noise. This DIY project is helpful for monitoring loudness in dB.
In this IoT project, we will make a simple Decibel Meter using ESP8266 & Sound Sensor. We will also use a small 0.96” I2C OLED Display to visualize the noise intensity locally. The Sound Sensor will detect the sound and convert it into an analog voltage which is read by Nodemcu ESP8266. Then Nodemcu connects to WiFi Network and uploads the data to Arduino IoT Cloud. So, you can monitor those parameters remotely from anywhere in the world.
Before starting, you can check the previous post to get started with Sound Sensor:
1. Decibel Meter using Sound Module & Arduino with LCD Display
Components Required
Now in this tutorial, we’re using ESP8266 NodeMCU, 0.96” SSD1306 I2C OLED, Sound sensor module, and some jumper cables. Here, we are using a breadboard for the assembly. So these are the hardware components required for making this project. All the components can be easily purchased from Amazon. The components purchase link is given below.
| S.N | Components Name | Quantity | |
|---|---|---|---|
| 1 | NodeMCU ESP8266-12E Board | 1 | https://amzn.to/3sCrEbj |
| 2 | LM393 Sound Sensor Module | 1 | https://amzn.to/3etAakz |
| 3 | 0.96" I2C OLED Display | 1 | https://amzn.to/3kvENyc |
| 4 | Few jumpers wires | 10 | https://amzn.to/3klh0A4 |
| 5 | Breadboard | 1 | https://amzn.to/3H2tbeQ |
Microphone Sound Sensor
This is a sound sensor module that I ordered recently to make a decibel meter. It has a perfect condenser mic that detects the level of sound from the sound-producing medium. The sound sensor is a small board that combines a microphone (50Hz-10kHz) and some circuit connections to convert sound waves into electrical pulses. This electrical pulse is fed to the LM393 which is a comparator IC. LM393 IC helps to digitize the signal and is available at the OUT pin.
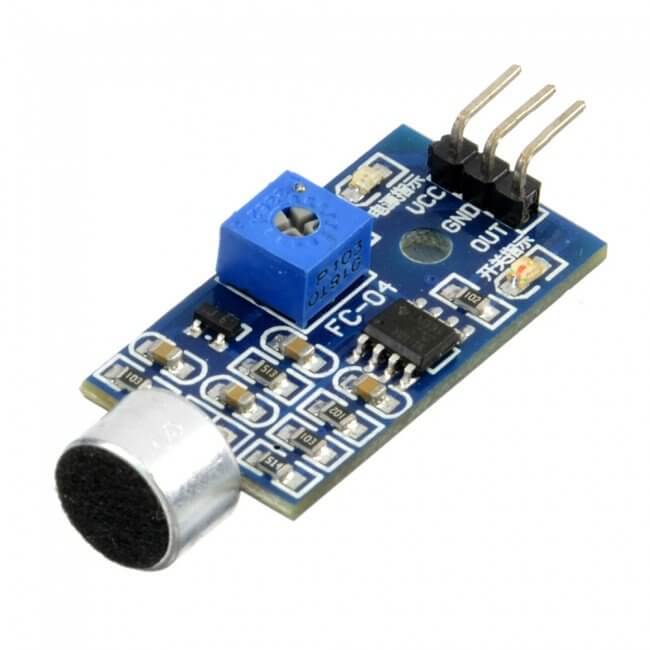
This Sound sensor has a potentiometer that is used to adjust the Sensitivity of the OUT signal. It has 3 pins that are OUT, VCC and GND.
Decibel meter with ESP8266 & 0.96” I2C OLED Display
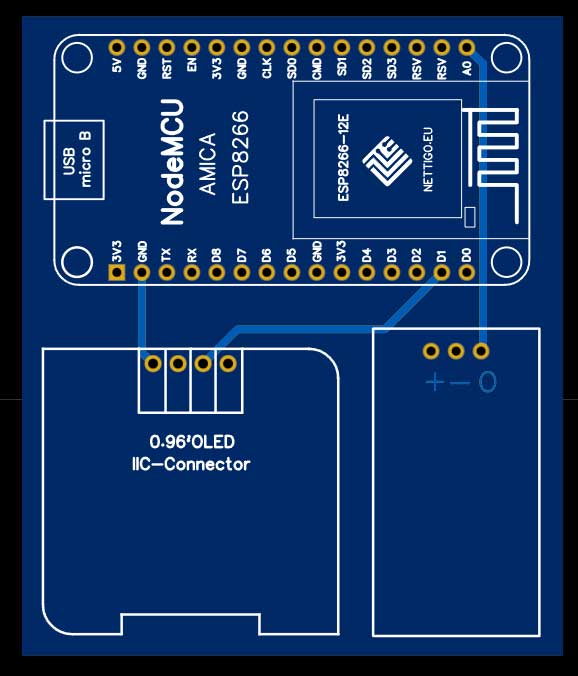
So here is the circuit diagram we have assembled on the breadboard.
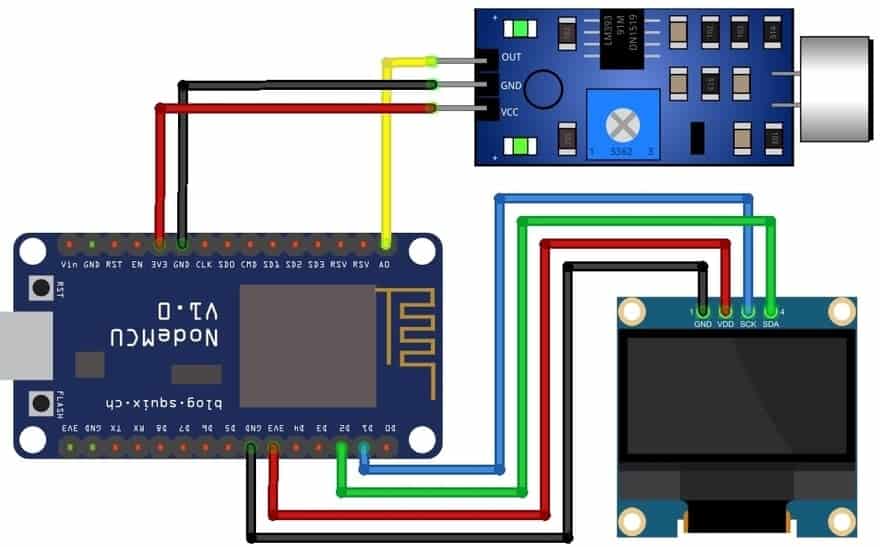
Connect the I2C Pins (SDA, SCL) of the OLED Display to D2 & D1 pins of NodeMCU ESP8266. Supply the OLED Display and sound sensor VCC and GND pins with 3.3V and GND Pins respectively. Similarly, the sound sensor is interfaced with the analog pin A0 of NodeMCU ESP8266.
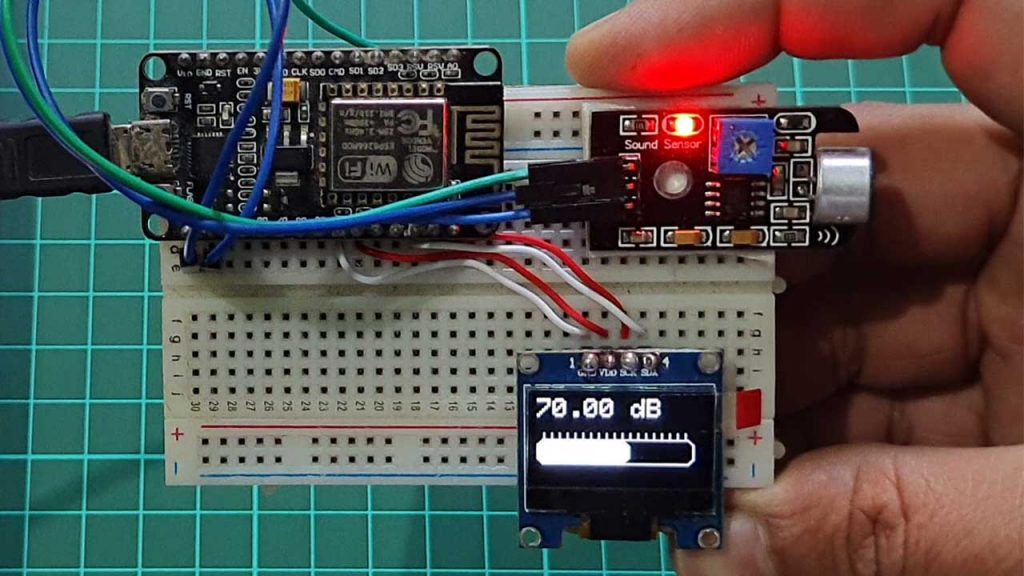
So here is the assembly on a breadboard. All the components are assembled as per the circuit diagram.
PCB Designing & Ordering
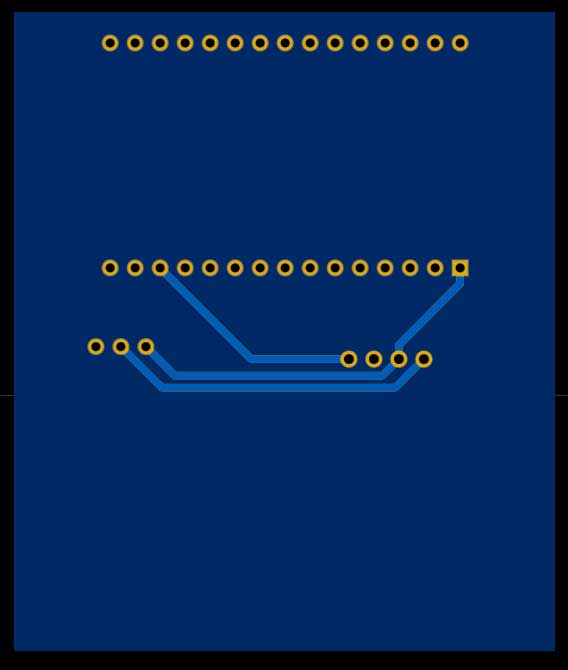
You can simply assemble the circuit on a breadboard. But if you don’t want to assemble the circuit on a breadboard, you can follow this schematic and build your own PCB. You can download the Gerber file of my PCB Design from the link attached below. The PCB looks like the image shown below.
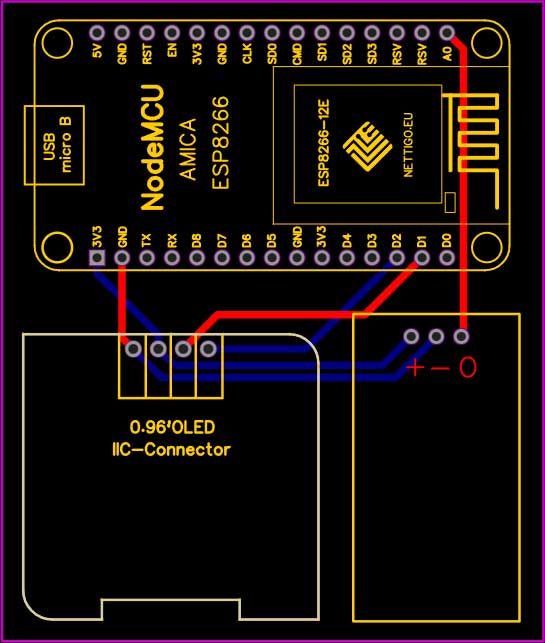
I provided the Gerber File for IoT-based Decibel Meter with ESP8266 & Sound Sensor PCB below.
You can simply download the Gerber File and order your custom PCB from PCBWay
Visit the PCBWay official website by clicking here: https://www.PCBWay.com/. Simply upload your Gerber File to the Website and place an order. I prefer PCBWay for ordering custom PCBs. PCBWay is a place that brings manufacturers and customers together. They have more than a decade of experience in this field of fabrication and prototyping and assembling of PCBs. PCBWay have proved their focus to their customers’ needs in terms of cost-effectiveness, delivery, and quality. And this can be proved by their outstanding customer reviews.
Setting Up Arduino IoT Cloud
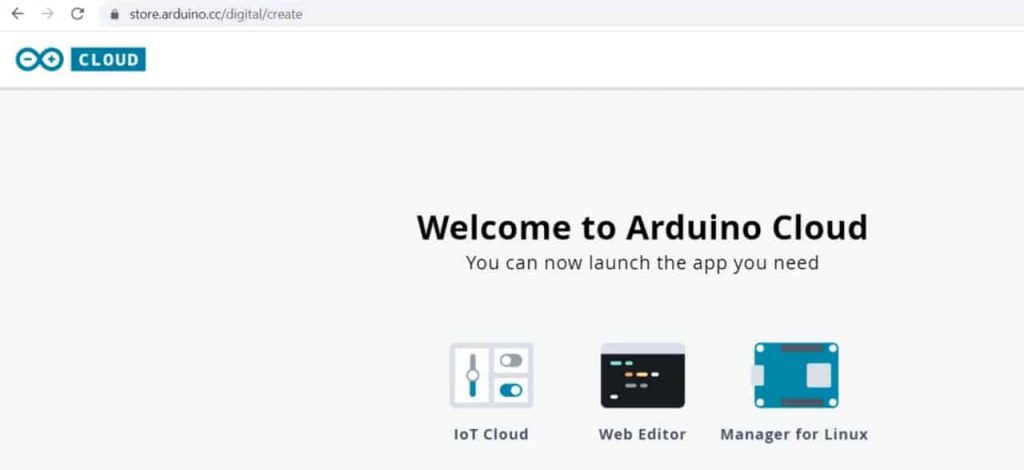
Now it’s time to set up the Arduino IoT Cloud Dashboard. So, go to the Arduino Store. Click on IoT Cloud.
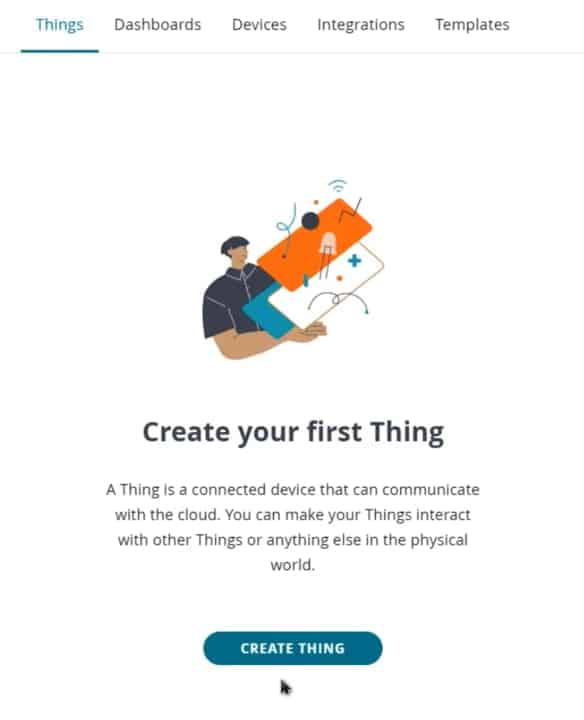
Then you need to create a Thing first. Click on create Thing and Give it a name anything like IoT Decibel Meter.
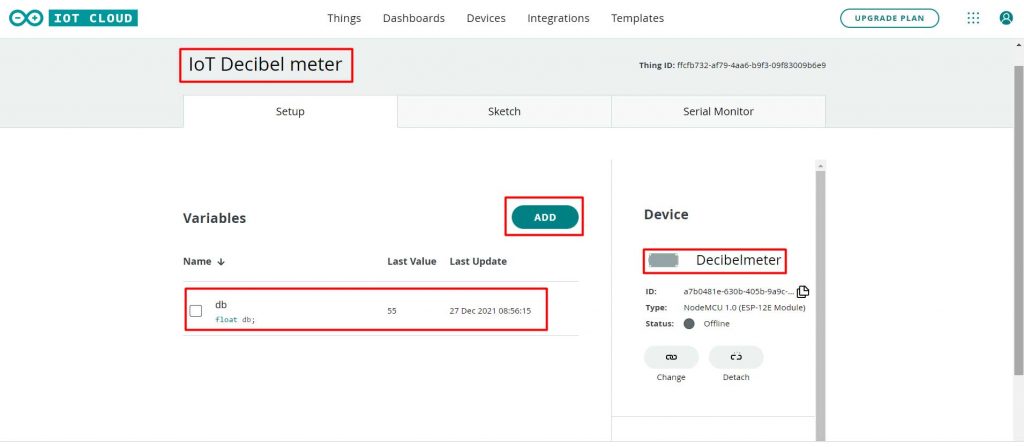
Now we need to create a variable. For that, click on add variable.
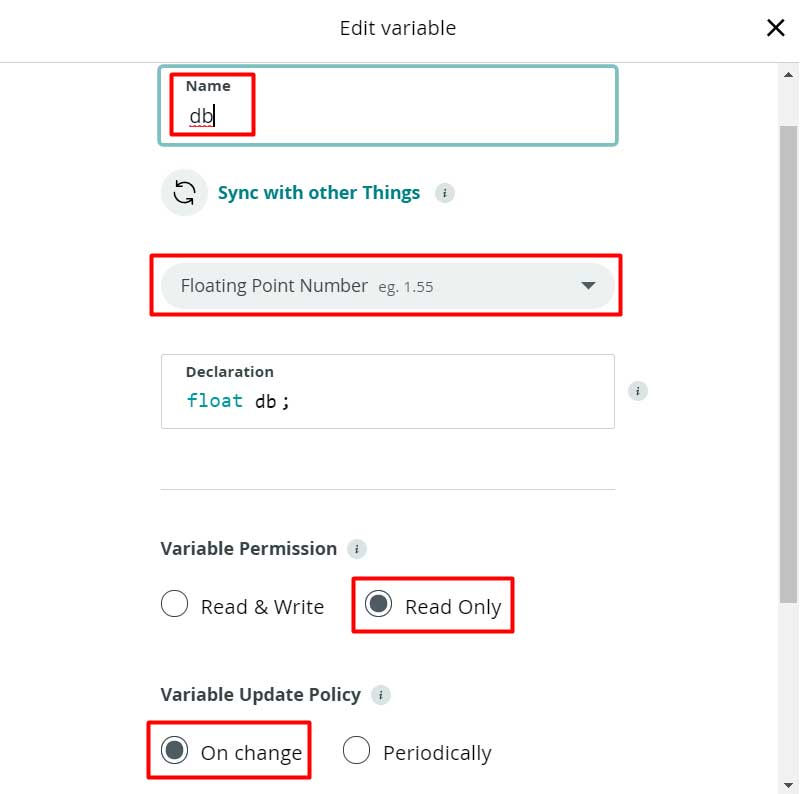
Name the variable anything like db. In the variable type, select Floating Point Number. So an automatic declaration of variables will be done. Now set the variable permission to Read-only. Then click on the Add variable button to create the first variable.
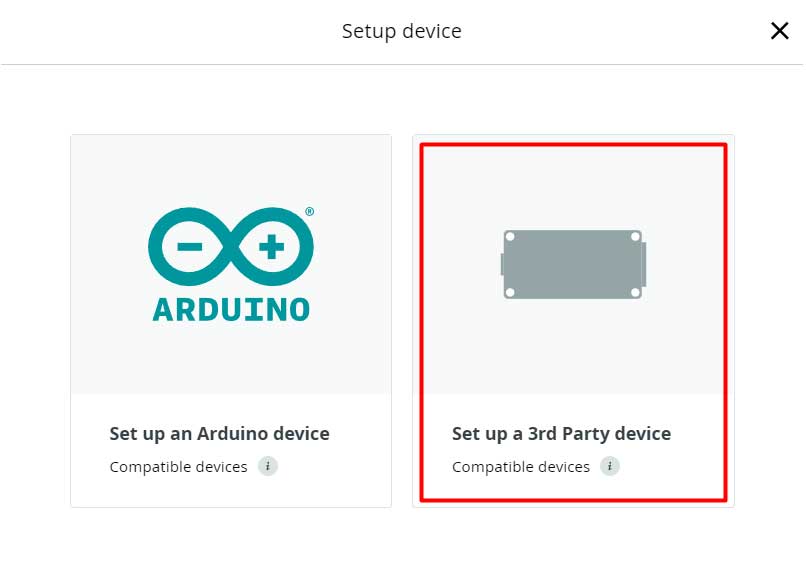
Now, we need to configure a device as well. For that, select the device option. From the list, select a 3rd party device. Then select ESP8266. From this list, select NodeMCU 1.0 ESP-12E Module.
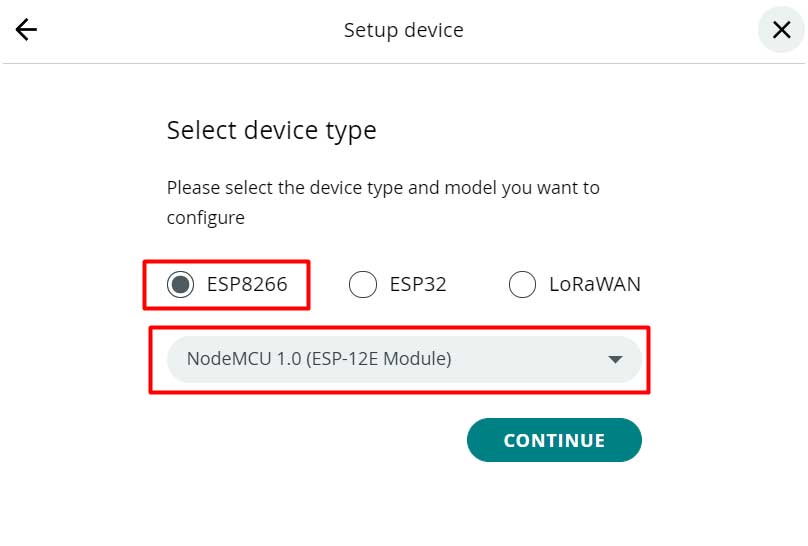
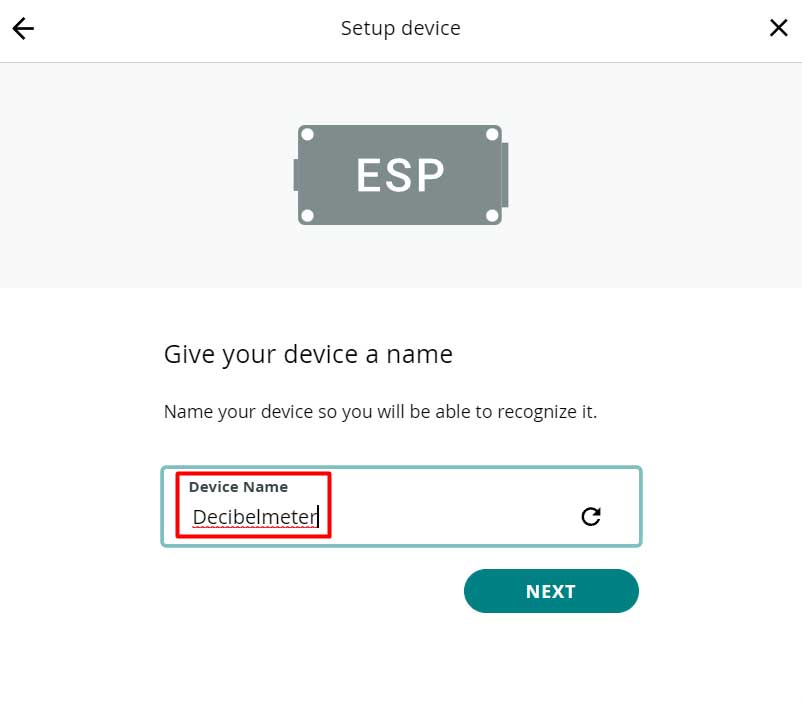
Click to continue and give any name to the device. Give any name like “Decibelmeter” Then click next.
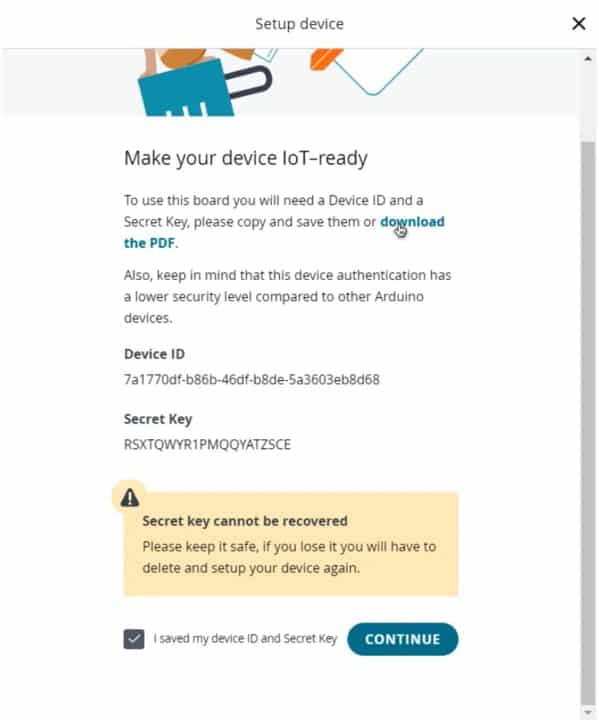
So device ID & Secret Key is created here. Save this device ID for the coding part. Or simply download this PDF File which has the information of Secret Key. Then click on continue.
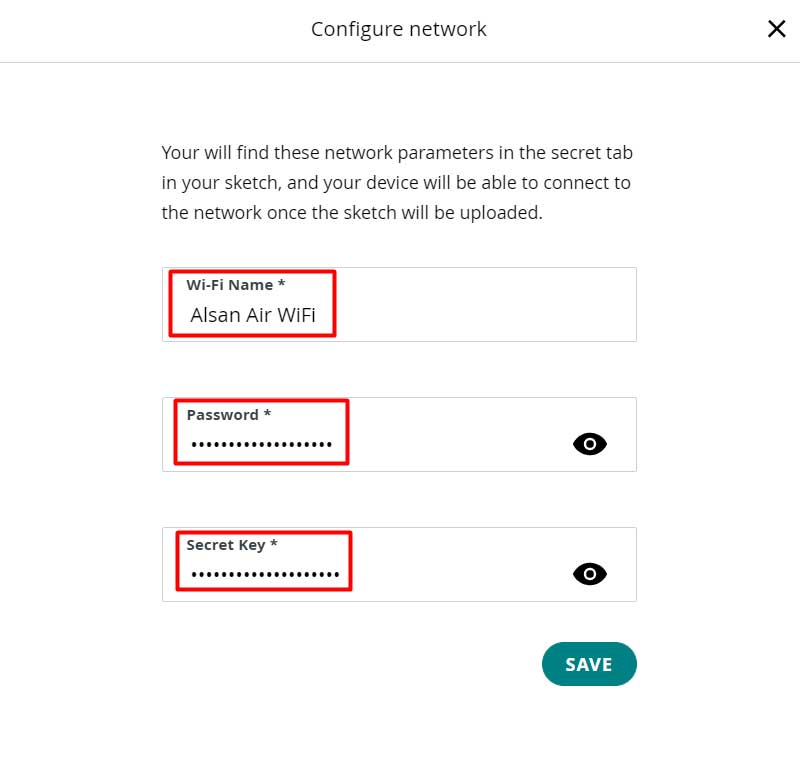
Now again, you need to set up the Network Credentials. So input your SSID, Password, and Secret Key that you created earlier. Finally, everything is set now.
Design Web and Mobile Dashboard
Go to the dashboard. Here we need to build a Web dashboard and Mobile app dashboard for monitoring live data from anywhere in the world.
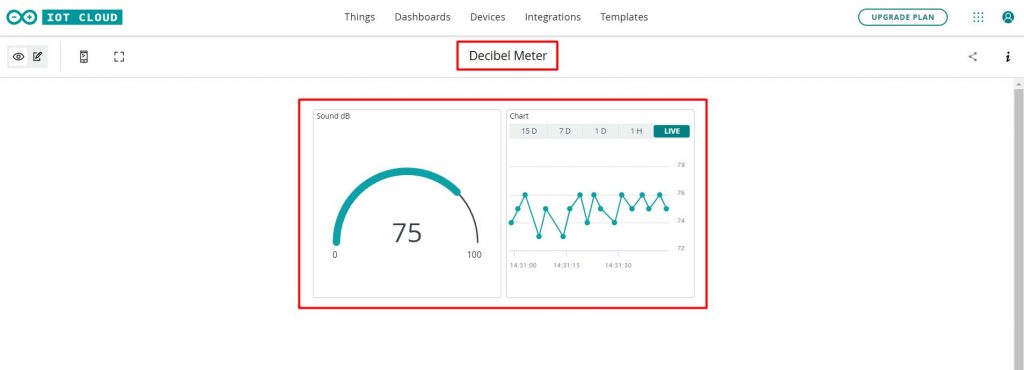
You can also provide a name to the dashboard. I am giving Decibel Meter as a dashboard name.
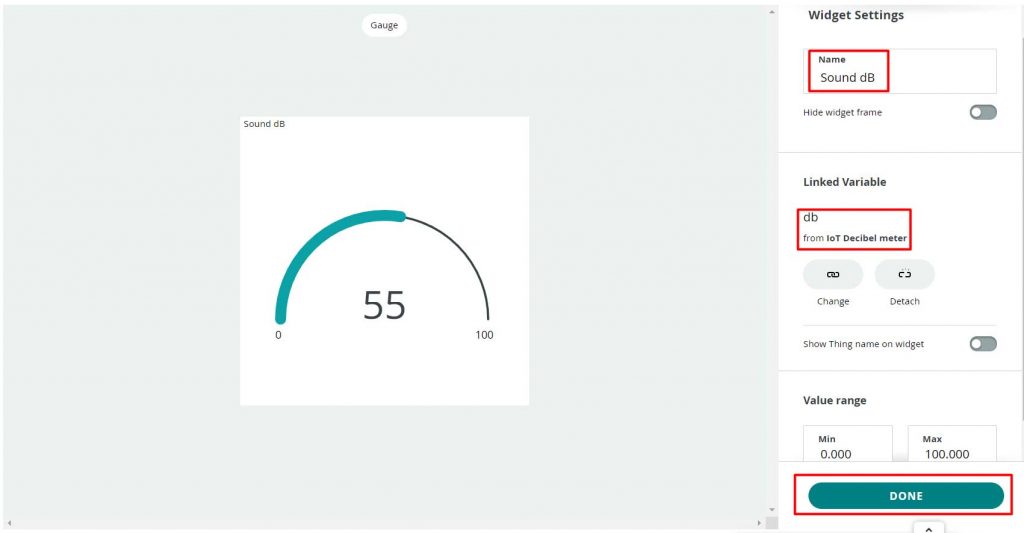
Now click on the add button. Then scroll down to select Gauge. Give it a name Sound dB. Then link a “db” variable that we have created earlier. Click on Done.
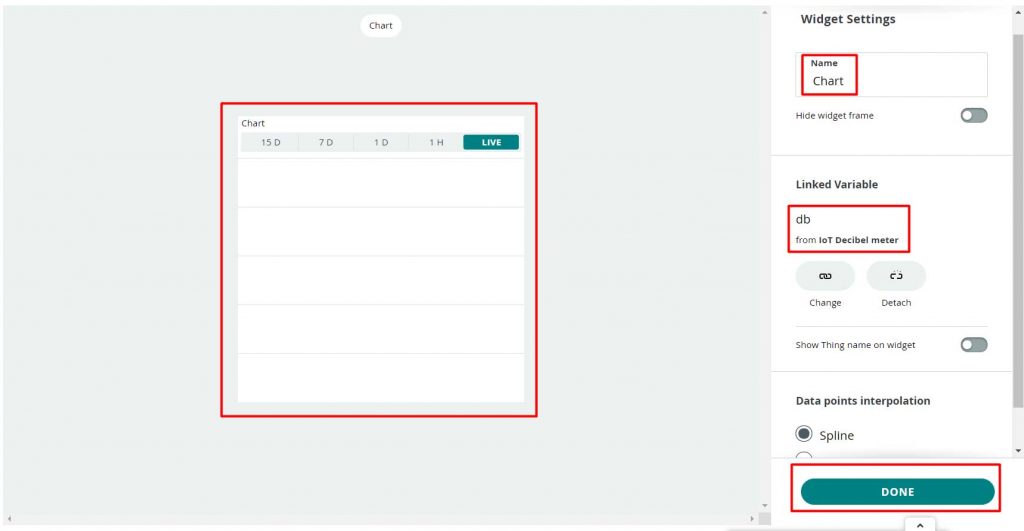
Similarly, add a chart widget and link the same variable. You can arrange and resize the widget as per your requirements.
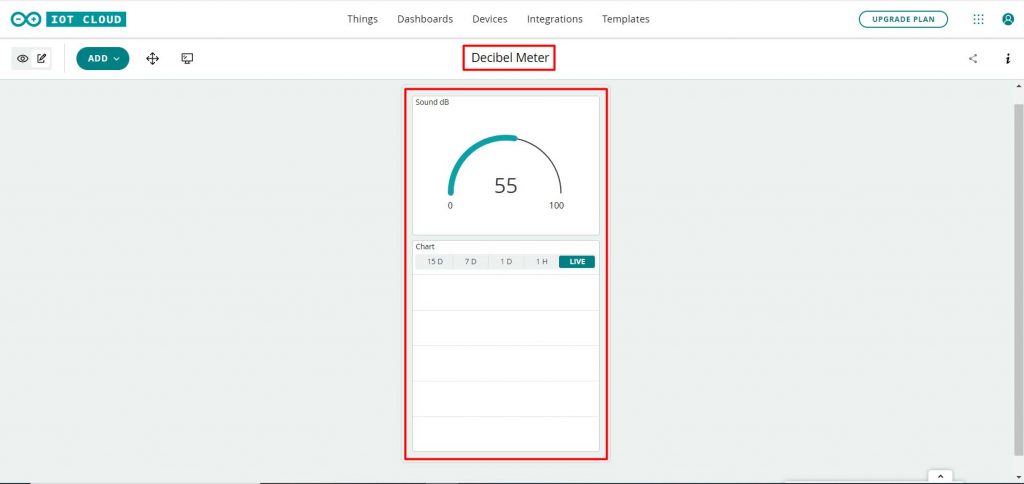
So finally, we are done with the IoT dashboard setup.
Source Code: Decibel meter with ESP8266 & Arduino IoT Cloud
This is the simple code that I have written in Arduino IDE. In this code, I have added the required library files and defined the A0 pin of the ESP8266 that we are using to detect the sound.
#include "thingProperties.h"
#include <SPI.h>
#include <Wire.h>
#include <Adafruit_GFX.h>
#include <Adafruit_SSD1306.h>

#define SCREEN_WIDTH 128    // OLED display width, in pixels
#define SCREEN_HEIGHT 64    // OLED display height, in pixels
#define OLED_RESET -1       // Reset pin # (or -1 if sharing Arduino reset pin)
Adafruit_SSD1306 display(SCREEN_WIDTH, SCREEN_HEIGHT, &Wire, OLED_RESET);
const int sampleWindow = 50;                              // Sample window width in mS (50 mS = 20Hz)
unsigned int sample;
Using this code we are converting the minimum and maximum voltage generated into a decibel value.
unsigned long startMillis= millis();                   // Start of sample window
   float peakToPeak = 0;                                  // peak-to-peak level

   unsigned int signalMax = 0;                            //minimum value
   unsigned int signalMin = 1024;                         //maximum value

                                                          // collect data for 50 mS
   while (millis() - startMillis < sampleWindow)
   {
      sample = analogRead(0);                             //get reading from microphone
      if (sample < 1024)                                  // toss out spurious readings
      {
         if (sample > signalMax)
         {
            signalMax = sample;                           // save just the max levels
         }
         else if (sample < signalMin)
         {
            signalMin = sample;                           // save just the min levels
         }
      }
   }
   peakToPeak = signalMax - signalMin;                    // max - min = peak-peak amplitude
   db = map(peakToPeak,20,900,49.5,90);             //calibrate for deciBels
Similarly, using this function we are displaying the sound intensity in dB using the Bar graph on OLED Display. And also updating db value to Arduino IoT Cloud.
display.setCursor(0,0);                                //cursor to upper left
   display.setTextSize(2);                                //set text size to 2
   display.print(db);                                     //write calibrated deciBels
   display.print(" dB");                                  //write units


    for(int x =5;x<114;x=x+6){                            //draw scale
      display.drawLine(x, 32, x, 27, WHITE);
    }
   display.drawRoundRect(0, 32, 120, 20, 6, WHITE);       //draw outline of bar graph
   int r = map(db,0,120,1,120);                           //set bar graph for width of screen
   display.fillRoundRect(1, 33, r, 18, 6, WHITE);         //draw bar graph with a width of r
   display.display();                                     //show all that we just wrote & drew
   display.clearDisplay();
   delay(150);
IoT Decibel Meter Complete Source code
/*
  Sketch generated by the Arduino IoT Cloud Thing "Decibel meter "
  https://create.arduino.cc/cloud/things/ffcfb732-af79-4aa6-b9f3-09f83009b6e9

  Arduino IoT Cloud Variables description

  The following variables are automatically generated and updated when changes are made to the Thing

  float db;

  Variables which are marked as READ/WRITE in the Cloud Thing will also have functions
  which are called when their values are changed from the Dashboard.
  These functions are generated with the Thing and added at the end of this sketch.
*/

#include "thingProperties.h"
#include <SPI.h>
#include <Wire.h>
#include <Adafruit_GFX.h>
#include <Adafruit_SSD1306.h>

#define SCREEN_WIDTH 128    // OLED display width, in pixels
#define SCREEN_HEIGHT 64    // OLED display height, in pixels
#define OLED_RESET -1       // Reset pin # (or -1 if sharing Arduino reset pin)
Adafruit_SSD1306 display(SCREEN_WIDTH, SCREEN_HEIGHT, &Wire, OLED_RESET);
const int sampleWindow = 50;                              // Sample window width in mS (50 mS = 20Hz)
unsigned int sample;

void setup() {
  // Initialize serial and wait for port to open:
   Serial.begin(115200);                                    //Serial comms for debugging
   display.begin(SSD1306_SWITCHCAPVCC, 0x3C);              //OLED display start
   display.display();                                     //show buffer
   display.clearDisplay();                                //clear buffer
   display.setTextSize(1);                                //Set text size to 1 (1-6)
   display.setTextColor(WHITE);                           //Set text color to WHITE (no choice lol)
   display.setCursor(20,20);                                //cursor to upper left corner
   display.println("Decibel Meter");               //write title
   display.display();                                     //show title
   delay(2000);

  // Defined in thingProperties.h
  initProperties();

  // Connect to Arduino IoT Cloud
  ArduinoCloud.begin(ArduinoIoTPreferredConnection);

  /*
     The following function allows you to obtain more information
     related to the state of network and IoT Cloud connection and errors
     the higher number the more granular information you’ll get.
     The default is 0 (only errors).
     Maximum is 4
 */
  setDebugMessageLevel(2);
  ArduinoCloud.printDebugInfo();

    display.clearDisplay();
    display.setCursor(20,20);
    display.setTextSize(1);
    display.setTextColor(WHITE);
    display.print("WiFi Connected");
    display.display();
    delay(4000);
    display.clearDisplay();
}

void loop() {
  ArduinoCloud.update();
  // Your code here
   unsigned long startMillis= millis();                   // Start of sample window
   float peakToPeak = 0;                                  // peak-to-peak level

   unsigned int signalMax = 0;                            //minimum value
   unsigned int signalMin = 1024;                         //maximum value

                                                          // collect data for 50 mS
   while (millis() - startMillis < sampleWindow)
   {
      sample = analogRead(0);                             //get reading from microphone
      if (sample < 1024)                                  // toss out spurious readings
      {
         if (sample > signalMax)
         {
            signalMax = sample;                           // save just the max levels
         }
         else if (sample < signalMin)
         {
            signalMin = sample;                           // save just the min levels
         }
      }
   }
   peakToPeak = signalMax - signalMin;                    // max - min = peak-peak amplitude
   db = map(peakToPeak,20,900,49.5,90);             //calibrate for deciBels
   display.setCursor(0,0);                                //cursor to upper left
   display.setTextSize(2);                                //set text size to 2
   display.print(db);                                     //write calibrated deciBels
   display.print(" dB");                                  //write units


    for(int x =5;x<114;x=x+6){                            //draw scale
      display.drawLine(x, 32, x, 27, WHITE);
    }
   display.drawRoundRect(0, 32, 120, 20, 6, WHITE);       //draw outline of bar graph
   int r = map(db,0,120,1,120);                           //set bar graph for width of screen
   display.fillRoundRect(1, 33, r, 18, 6, WHITE);         //draw bar graph with a width of r
   display.display();                                     //show all that we just wrote & drew
   display.clearDisplay();
   delay(150);

}
Apart from the code part, we need to upload the code. But before that, we need to install an Agent to flash the code directly from the browser. Follow the instructions on your screen to install the agent. Once the driver is installed, the COM port will appear.
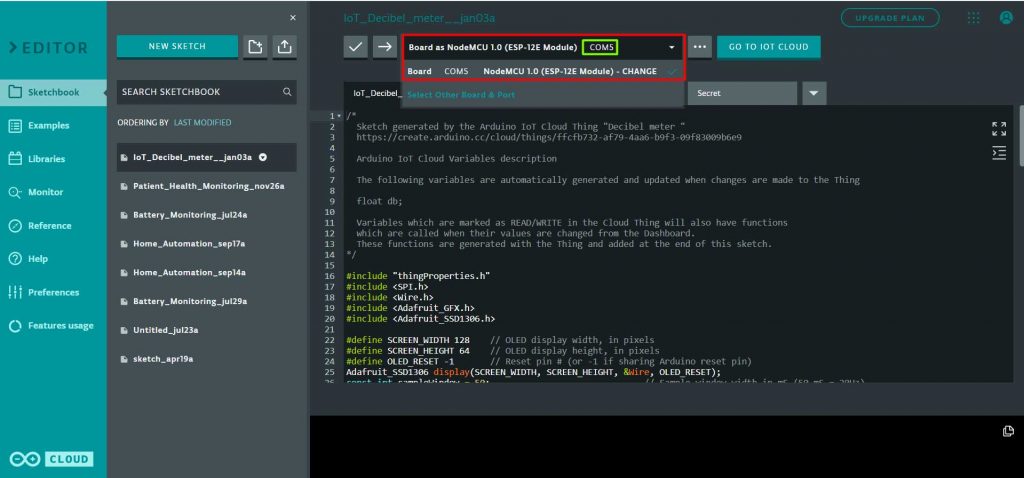
Then select the ESP8266 NodeMCU Board from the list and the COM port as well. Then, upload the code. It will take some time to upload the code and when it’s done, some upload success message will appear.
Our previous ESP8266 & Arduino IoT Cloud-based projects:
- Home Automation system with Arduino IoT cloud using ESP8266
- Patient health monitoring system using ESP8266 & Arduino IoT Cloud
- Battery status monitoring system using NodeMCU & Arduino IoT
- Amazon Alexa & Arduino IoT based Home Automation
Testing: IoT based Decibel Meter using ESP8266, OLED & Arduino IoT Cloud
After the code is uploaded the NodeMCU will try connecting to WiFi Network. After a successful WiFi connection, the device is connected to Arduino IoT Cloud Dashboard. You can observe this process on the OLED Display. Now you can play some music and observe the value on the Display.
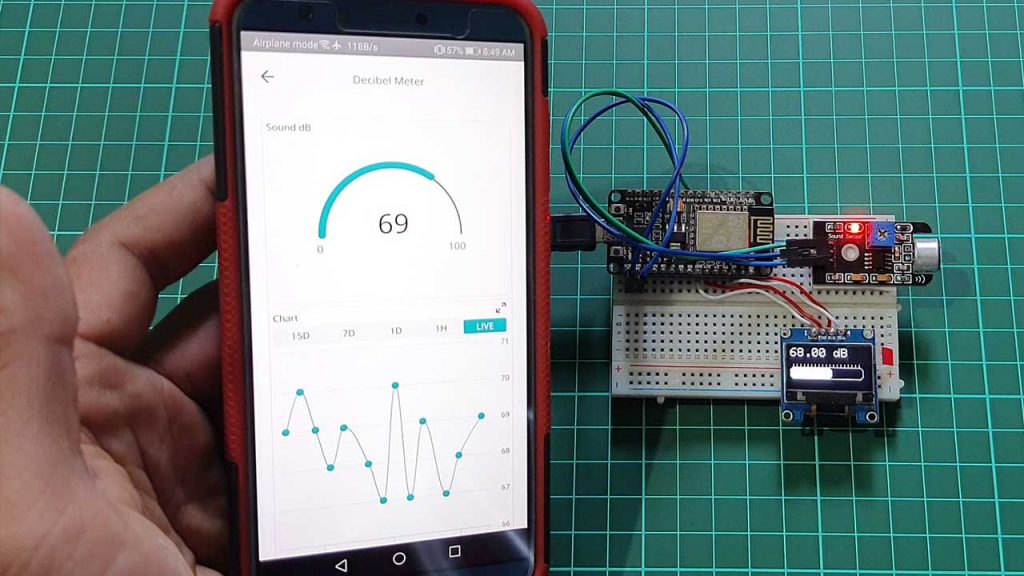
Now open the dashboard, so you can monitor the real-time data of sound intensity in dB as shown in the image below.
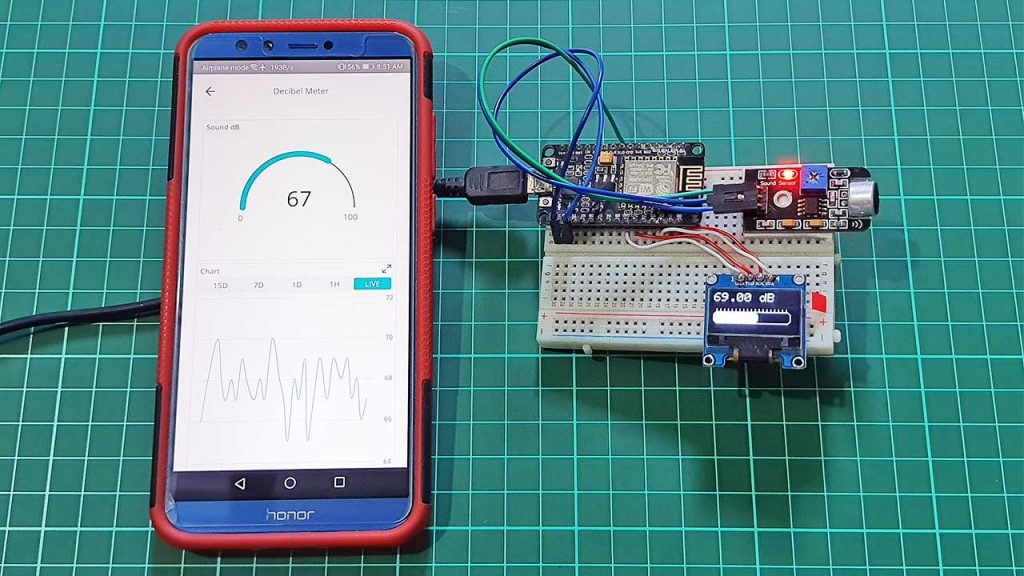
You can also monitor this parameter from the Mobile Dashboard. For that install Arduino IoT Remote from Playstore. Sign in using the same User ID and Password. Now Open the dashboard to monitor the data remotely.
Video Tutorial & Guide
Conclusion
This tutorial shows you how to make an IoT-based Decibel Meter with ESP8266 & Sound Sensor using Arduino IoT Cloud. I hope this tutorial was interesting to you. If you need any type of help related to this project, then let me know in the comment section below.

Thanks for you project.
When the ambient sound is low, I get always the constant reading 2440370.00 dB but if the sound gets louder, there is a threshold over which the readings seem good, or at least what you’d expect
Thanks in advance
Related to my earlier reply, in fact there is not a clear cut correlation between readings and perceived loudness…