Today, In this session, we are going to look at how we can Measure Pitch Roll and Yaw Angles Using the MPU6050 Gyro/Accelerometer sensor and Arduino.
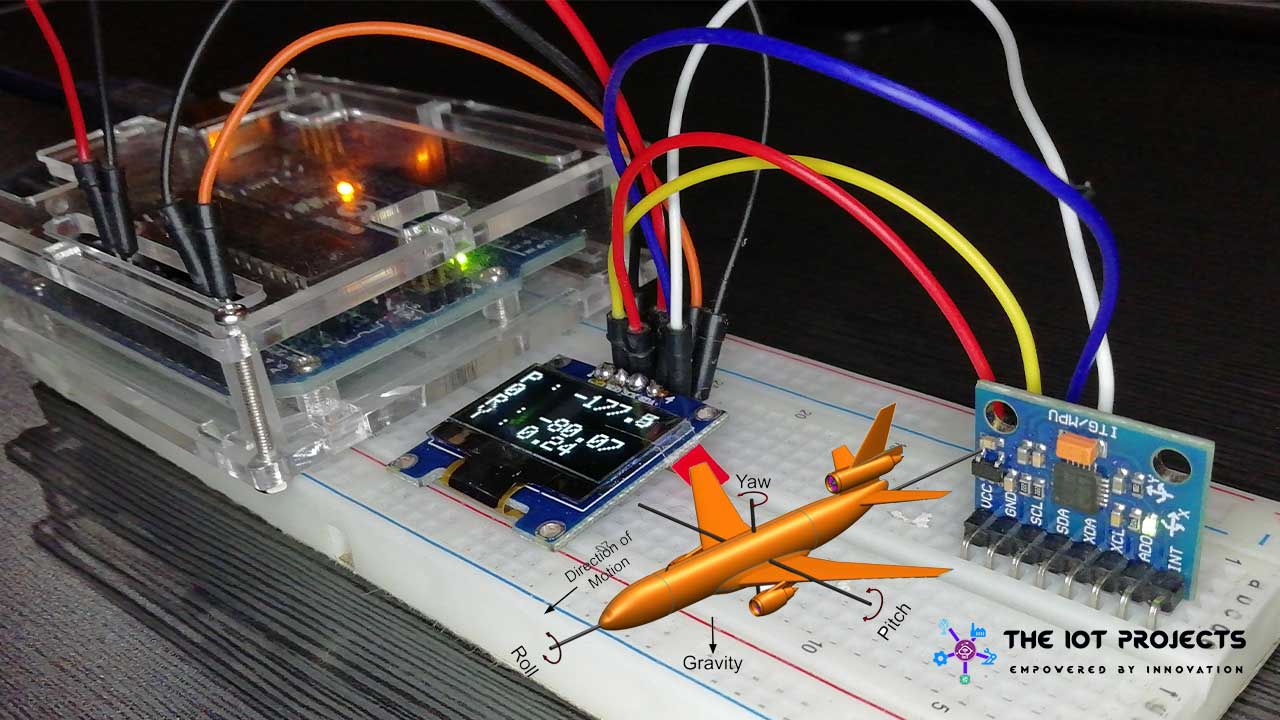
So what can a Gyro do? Simply, it can detect the orientations. MPU6050 detects movements in 3-directions, X-axis, Y-axis, and Z-axis. But, in terms of the flight control system, we have three terms Pitch, Roll, and Yaw. We have an embedded video below, which makes you clear about the direction of Pitch, Roll, and Yaw.
Going through the project details, you will find a sample code, circuit diagram, and a list of associated parts.
Components Required
The following is the list of the components that are required for measuring pitch, roll, and yaw using the MPU6050 sensor. You can buy all of the required components from Amazon.
| S.N | Components Name | Description | Quantity | |
|---|---|---|---|---|
| 1 | Arduino UNO | ARDUINO UNO R3 | 1 | https://amzn.to/2L0iZf2 |
| 2 | MPU6050 | MPU6050 6-axis Gyroscope/Accelerometer | 1 | https://amzn.to/39OEuKk |
| 3 | OLED Display | 0.96' OLED (SSD1306) | 1 | https://amzn.to/3n0nlA6 |
| 4 | Breadboard | Solderless Breadboard MIni | 1 | https://amzn.to/3n33uRT |
| 5 | Jumper Wires | Jumper Cables breadboard friendly | 8 | https://amzn.to/2JWSR44 |
Note: You do not need an OLED display for basic testing, the results can be sent via your serial monitor as you wish. I use it because it makes it easier to see things on a serial monitor instead of a scrolling list of numbers. You can also use Arduino Nano instead of Arduino UNO.
Circuit Diagram for Measuring Pitch, Roll, and Yaw
MPU6050 Gyro/Accelerometer is an I2C Module. So we just need 4 wires to interface it with Arduino. Just hook the SCL and SDA pin of MPU6050 to the A5 and A4 pin of Arduino respectively. As always, connect VCC to 5V and GND to GND.
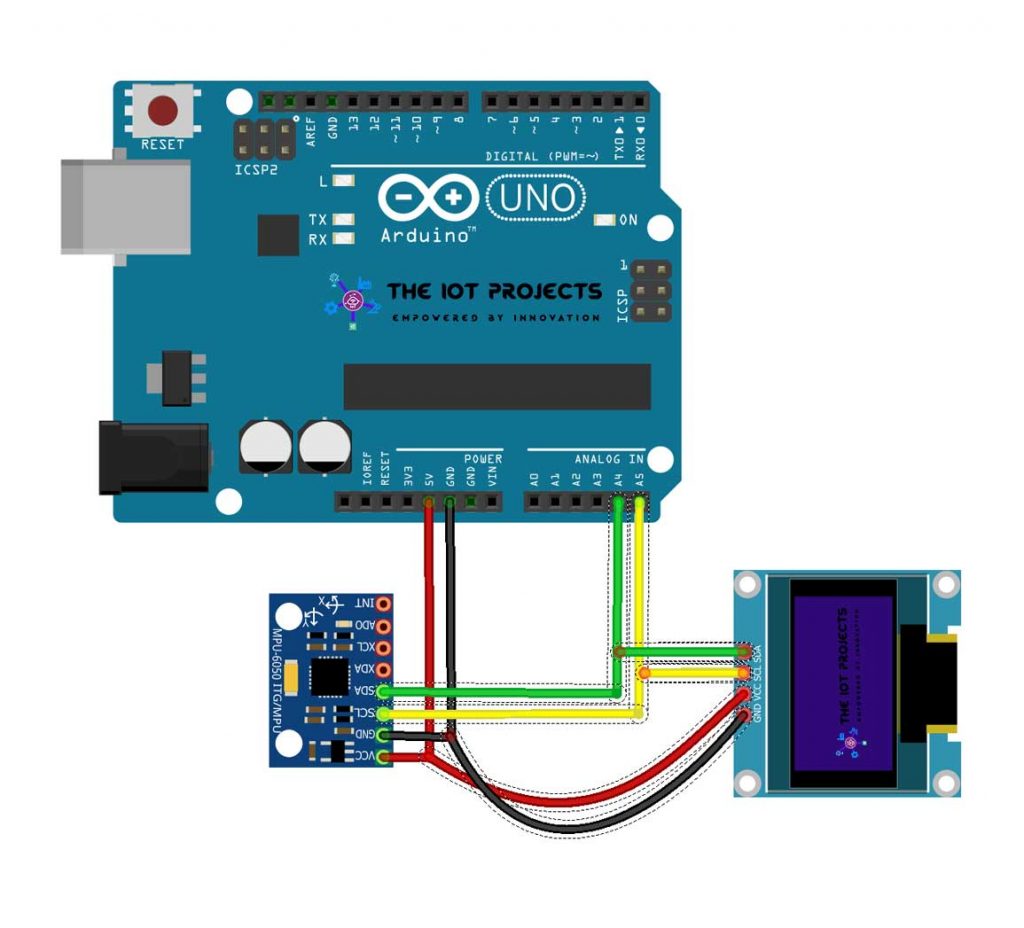
As already mentioned you don’t need OLED Display to test this project. But, if you want then Interface the SCL and SDA pin of OLED Display to the same pin connected to MPU6050 SCL and SDA pin.
Some More MPU6050 based Projects:
- IoT based Fall Detection using NodeMCU and MPU6050 Sensor
- Monitor MPU6050 Tilt Angle on Blynk using NodeMCU
Program Code for Measuring Pitch Roll and Yaw Angles
The MPU6050 is a versatile sensor that can measure its orientation and it has acceleration in all three dimensions. However, it was difficult to find a user-friendly work library. The one in which I finally settled (almost after 4 hours of effort) was the MPU_6050_light library. It is available within the Arduino IDE Library Manager – as shown in the video.
So, here under the void setup part, we are calibrating the MPU6050 sensor. This step is only important for measuring Yaw angles. For, the pitch and Roll calibrating process is not necessary. But, if you don’t calibrate MPU6050 for calculating Yaw it shows a random increment value.
/* Get tilt angles on X and Y, and rotation angle on Z
    Angles are given in degrees
 License: MIT
 */
 #include "Wire.h"
 #include <MPU6050_light.h>
 MPU6050 mpu(Wire);
 unsigned long timer = 0;
 void setup() {
   Serial.begin(9600);
   Wire.begin();
 byte status = mpu.begin();
   Serial.print(F("MPU6050 status: "));
   Serial.println(status);
   while (status != 0) { } // stop everything if could not connect to MPU6050
 Serial.println(F("Calculating offsets, do not move MPU6050"));
   delay(1000);
   mpu.calcOffsets(); // gyro and accelero
   Serial.println("Done!n");
 }
 void loop() {
   mpu.update();
 if ((millis() - timer) > 10) { // print data every 10ms
     Serial.print("X : ");
     Serial.print(mpu.getAngleX());
     Serial.print("tY : ");
     Serial.print(mpu.getAngleY());
     Serial.print("tZ : ");
     Serial.println(mpu.getAngleZ());
     timer = millis();
   }
 }
Now upload this example code to your Arduino Board for measuring Pitch Roll and Yaw using MPU6050 Sensor. But, make sure you have chosen the correct board and port from the tools menu. Now, you see the results on the serial monitor.
Program Code with OLED Display
So, to display the results on an OLED Display you need to install two more libraries from Arduino IDE Library Manager. They are Adafruit_GFX.h and Adafruit_SSD1306.h. Both libraries are from Adafruit
/* Get tilt angles on X and Y, and rotation angle on Z
 Angles are given in degrees, displays on SSD1306 OLED
 License: MIT
 */
 #include <Wire.h>
 #include <Adafruit_GFX.h>
 #include <Adafruit_SSD1306.h>
 #include <MPU6050_light.h>
 define SCREEN_WIDTH 128 // OLED display width, in pixels
 define SCREEN_HEIGHT 64 // OLED display height, in pixels
 // Declaration for an SSD1306 display connected to I2C (SDA, SCL pins)
 Adafruit_SSD1306 display(SCREEN_WIDTH, SCREEN_HEIGHT, &Wire);
 MPU6050 mpu(Wire);
 unsigned long timer = 0;
 void setup() {
   Serial.begin(115200);                           // Ensure serial monitor set to this value also
   if(!display.begin(SSD1306_SWITCHCAPVCC, 0x3C))  // Address 0x3C for most of these displays, if doesn't work try 0x3D
   {
     Serial.println(F("SSD1306 allocation failed"));
     for(;;);                                      // Don't proceed, loop forever
   }
   display.setTextSize(1);
   display.setTextColor(SSD1306_WHITE);            // Draw white text
   display.clearDisplay();
   Wire.begin();
   mpu.begin();
   display.println(F("Calculating gyro offset, do not move MPU6050"));
   display.display();
   mpu.calcGyroOffsets();                          // This does the calibration
   display.setTextSize(2);
 }
 void loop() {
   mpu.update();
   if((millis()-timer)>10)                         // print data every 10ms
   {
     display.clearDisplay();                       // clear screen
     display.setCursor(0,0);
     display.print("P : ");
     display.println(mpu.getAngleX());
     display.print("R : ");
     display.println(mpu.getAngleY());
     display.print("Y : ");
     display.print(mpu.getAngleZ());
     display.display();                            // display data
     timer = millis();
   }
 }
Now upload this program code to your Arduino Board for measuring Pitch Roll and Yaw using MPU6050 Sensor and Displaying result in the OLED Display. But, make sure you have chosen the correct board and COM port from the tools menu.
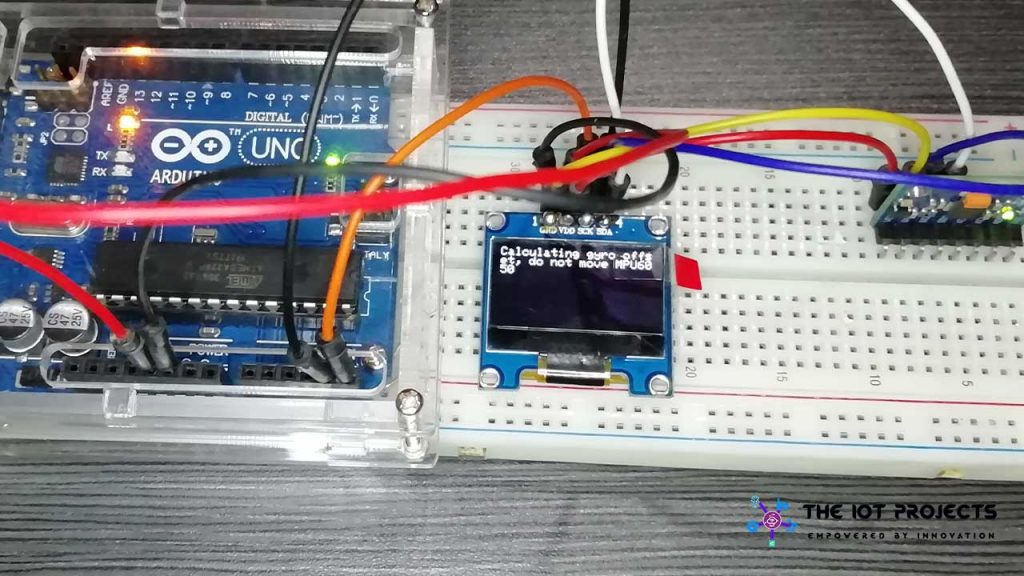
Pitch Roll and Yaw Demonstration using Arduino
For the first time you can see on the display it is asking to hold MPU6050 in a stable position. After calibrating the sensor Pitch Roll and Yaw Angles can be seen on the display.
Conclusion
This project may be useful for you. Like if you are working with self-balancing robots, drone balancing projects, or any other similar to this. So that’s all for Measure Pitch Roll and Yaw Angles Using MPU6050 and Arduino projects. I hope you enjoyed this post. Please share the project with your friends.
Recommended readings:
- Capacitive Soil Moisture Sensor with OLED Display & Arduino
- IoT Based RFID Smart Door Lock System Using NodeMCU ESp8266
- Temperature Controlled Home Automation using Arduino
- IoT Weather Station using DHT11 Sensor
- LoRa Based Wireless Weather Station using Arduino & ESP32
- RFID Master Card Door Lock System using Arduino
- IoT Based Voice Controlled Home Automation Using NodeMCU & Android
TThank you so much for the tutorial! This tutorial worked great and really helped me get through the task.
Hi, your code works fine for the X and Y, but for some reason whichever axis is parallel just moves when you turn it and then returns back to zero. I really need this axis for a project I’m working on so if you could reply soon that would be great. Thank in advance.